At a Glance
| Property | Value |
|---|---|
| Evidence Level | Moderate (established technology, validated databases) |
| Primary Use | Functional brain assessment and neurofeedback protocol design |
| Key Mechanism | 19-channel EEG recording compared to normative databases identifies specific brainwave dysregulation patterns |
What a qEEG Actually Measures
If you have been told you need a qEEG brain map — or you are considering one because your brain fog has not responded to treatment — here is exactly what this assessment involves and what it can tell you.
A standard clinical EEG records raw brain electrical activity and is read by a neurologist looking for abnormalities like seizure discharges. A quantitative EEG (qEEG) takes that same raw data and submits it to sophisticated statistical analysis, comparing your brain’s electrical patterns to normative databases of healthy individuals matched by age.
The process works as follows:
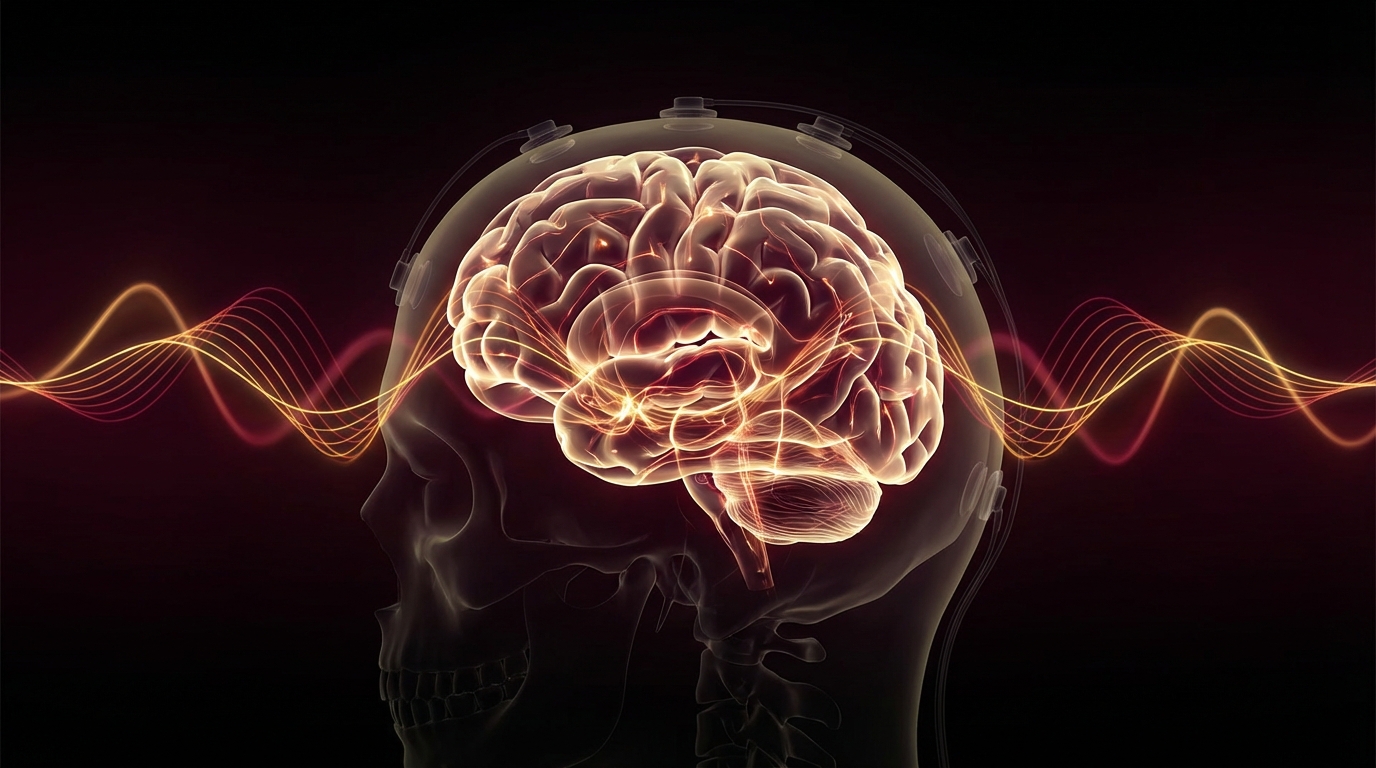
Recording: A cap with 19 electrode sensors (following the international 10-20 system) is placed on your scalp. These sensors detect microvolt-level electrical potentials generated by cortical neurons. The recording typically takes 20-30 minutes, with segments recorded in eyes-open and eyes-closed conditions [1].
Processing: The raw EEG data is cleaned of artifacts (eye blinks, muscle tension, electrical interference) and decomposed using Fast Fourier Transform into frequency bands — delta (1-4 Hz), theta (4-8 Hz), alpha (8-12 Hz), beta (13-30 Hz), and high beta/gamma (30-50 Hz).
Comparison: Your frequency band amplitudes, power ratios, and coherence values at each electrode site are compared to age-matched normative databases (typically the Neuroguide, BrainDx, or qEEG-Pro databases). Deviations beyond 1.5-2 standard deviations from the norm are flagged as dysregulated.
Visualization: The results are displayed as colored topographic brain maps — “hot spots” showing where your brain deviates from normal patterns.
What the Maps Reveal
Absolute and Relative Power
Power maps show how much electrical energy your brain produces in each frequency band at each location. In brain fog patients, the most common finding is:
- Excess frontal theta power: The frontal lobes, responsible for attention and executive function, are producing too much slow-wave activity. This is the electrophysiological signature of the “foggy” brain.
- Deficient posterior alpha peak frequency: Healthy adults typically show an alpha peak around 10 Hz. In chronic illness patients, this peak often shifts downward to 8-9 Hz, reflecting global cortical slowing.
- Deficient frontal beta: Reduced fast-wave activity in prefrontal regions correlates with slow processing speed and poor sustained attention.
Coherence
Coherence maps measure how well different brain regions communicate with each other. Think of it as the quality of the “wiring” between areas. In Lyme disease and post-COVID brain fog, I commonly see:
- Reduced frontal-parietal coherence: The attention network is disconnected
- Increased slow-wave coherence: Brain regions are “stuck” communicating at low frequencies
- Asymmetric patterns: One hemisphere may show significantly different patterns from the other
Phase and Connectivity
Advanced qEEG analysis (LORETA or sLORETA) creates three-dimensional maps estimating the source of electrical activity deeper in the brain — not just at the cortical surface. This identifies dysregulation in subcortical structures like the anterior cingulate cortex (involved in error monitoring and emotional regulation) or the insula (involved in interoception and autonomic awareness).

Common qEEG Patterns in Chronic Illness
Based on my clinical experience and published literature, these patterns appear frequently in patients with chronic infections and post-infectious syndromes:
Lyme Disease Brain Fog
- Frontal and central theta excess (4-8 Hz)
- Reduced beta power frontal (13-20 Hz)
- Slowed alpha peak frequency
- Reduced left-right frontal coherence
Post-COVID Cognitive Dysfunction
- Widespread theta excess, often more diffuse than Lyme
- Reduced alpha reactivity (alpha does not suppress normally when eyes open)
- Altered default mode network coherence
Mold/CIRS-Related Cognitive Symptoms
- Generalized slowing across multiple frequency bands
- Reduced beta power globally
- Often accompanied by high-amplitude artifact from autonomic instability
Anxiety-Predominant Presentations
- Excess high beta (20-30 Hz) over frontal and central regions
- Reduced alpha power (the “relaxation brake” is weak)
- Increased right frontal activation relative to left (associated with withdrawal motivation)
Post-Concussion/TBI
- Focal slowing at the injury site
- Reduced coherence in long-range connections
- Excess delta activity at or near the impact area
Who Should Get a qEEG
In my clinical experience, a qEEG brain map is valuable for:
-
Any patient considering neurofeedback: The qEEG is not optional for quality neurofeedback. It identifies the specific targets that need training. Neurofeedback without a qEEG is like prescribing eyeglasses without an eye exam.
-
Brain fog patients who need objective documentation: “Brain fog” is a subjective complaint. A qEEG provides objective, quantifiable evidence of cortical dysfunction. This can be valuable for disability documentation, treatment justification, and monitoring progress.
-
Patients who have failed conventional evaluation: Normal MRI, normal standard EEG, normal neurological exam — but clearly impaired cognitively. The qEEG identifies functional dysfunction that structural imaging misses.
-
Before and after treatment monitoring: Repeating the qEEG after treatment (whether neurofeedback, infection treatment, or photobiomodulation) provides objective evidence of whether the brain’s electrical patterns have normalized.
-
Differentiating overlapping conditions: A patient with both anxiety and brain fog — is the anxiety driving the fog, or is the brain fog driving the anxiety? The qEEG pattern can help distinguish these and guide treatment targeting.
What qEEG Does NOT Tell You
Let me be honest about the limitations:
- qEEG does not diagnose Lyme disease, COVID, or any specific medical condition. It shows patterns of brain dysfunction, not their cause.
- qEEG is not FDA-cleared as a standalone diagnostic tool for any psychiatric or neurological diagnosis. It is an adjunctive assessment.
- Not all “abnormal” patterns require treatment. Some deviations from the norm are individual variants. Clinical correlation is essential.
- The quality of the qEEG depends on the clinician. Artifact rejection, recording quality, and interpretation all require expertise. A poorly done qEEG is worse than no qEEG.
The Evidence
Established Applications (Strong Evidence)
qEEG is well-validated as a research tool and clinical adjunct for:
- Identifying seizure disorders (used as standard clinical EEG)
- Discriminant analysis for ADHD subtypes
- Predicting treatment response to medications in depression
- Guiding neurofeedback protocols (the primary clinical application) [2]
Growing Applications (Moderate Evidence)
- Monitoring brain function changes in chronic illness treatment
- Identifying patterns associated with traumatic brain injury
- Assessing cognitive decline in aging populations
- Objective measurement of cognitive dysfunction in post-infectious syndromes
What I See in Practice
In our hospital, we use qEEG as part of the comprehensive workup for patients with persistent cognitive dysfunction. It serves two purposes: guiding neuromodulation treatment and providing patients with objective evidence that their brain fog is real and measurable.
What I tell my patients: this test will not tell us what infection you have. What it will tell us is exactly how your brain is functioning right now — which regions are underperforming, which are overactivated, and how well they are communicating. That gives us a treatment map and a baseline to measure your progress against.

Practical Application
What to Expect During the Test
- Duration: 45-60 minutes total (20-30 minutes of actual recording plus setup and cleanup)
- Preparation: Wash your hair the morning of the test (no conditioner or styling products). Avoid caffeine for 2 hours before.
- Procedure: A cap with sensors is placed on your head. Conductive gel is applied to each sensor site. You sit quietly — first with eyes closed, then eyes open. No needles, no electrical stimulation, no discomfort.
- Results: Processing and interpretation typically take 3-7 days. You will receive a report with topographic maps and a clinical interpretation.
Cost and Access
qEEG assessments typically range from 300-800 USD depending on location and provider. Some insurance plans cover the assessment when ordered for specific indications (epilepsy evaluation, ADHD assessment). Coverage for brain fog or chronic illness evaluation is less consistent.
How to Use the Results
The qEEG report should directly inform your treatment approach:
- Identified excess theta, frontal: Neurofeedback protocol targeting theta reduction and beta enhancement at those sites
- Slowed alpha peak: Consider photobiomodulation to improve mitochondrial function driving the slowing
- Excess high beta: May indicate anxiety-predominant pattern; consider vagus nerve stimulation and relaxation-oriented training
- Coherence abnormalities: Advanced coherence training protocols in neurofeedback
Safety and Considerations
qEEG brain mapping is entirely non-invasive and carries no physical risk. The sensors are passive — they only record; they do not emit anything. There are no contraindications.
The main consideration is interpretive accuracy. Ensure your qEEG is performed and interpreted by someone with appropriate training (QEEG-D or QEEG-T certification from the EEG and Clinical Neuroscience Society, or equivalent). Over-interpretation of normal variants and under-recognition of artifact are the most common pitfalls.
The Bottom Line
A qEEG brain map provides an objective, quantifiable picture of how your brain is functioning electrically. For patients with brain fog, cognitive dysfunction, or neurological symptoms from chronic illness, it identifies specific patterns of dysregulation that guide treatment — particularly neurofeedback — and provides measurable benchmarks for tracking recovery. It does not diagnose the underlying disease, but it shows exactly how the disease has affected brain function. In a field where patients are often told “your MRI is normal, so nothing is wrong,” the qEEG provides the evidence that something is, in fact, measurably different.
References
- Thatcher RW. Validity and Reliability of Quantitative Electroencephalography. Journal of Neurotherapy. 2010;14(2):122-152. DOI: 10.1080/10874201003773500.
- Arns M, et al. A Decade of EEG Theta/Beta Ratio Research in ADHD: A Meta-Analysis. Journal of Attention Disorders. 2013;17(5):374-383. PMID: 22617866.
- Coben R, Mohammad-Rezazadeh I, Cannon RL. Using quantitative and analytic EEG methods in the understanding of connectivity in autism spectrum disorders. Frontiers in Human Neuroscience. 2014;8:1045. PMC4275033.