Standard annual blood work was designed to detect disease, not to optimize health. A conventional metabolic panel and CBC will tell you if you have diabetes, kidney failure, or severe anemia. What it will not tell you is whether you are aging faster than you should, whether your mitochondria are functioning efficiently, whether your inflammatory burden is accelerating tissue damage, or whether your hormonal status is contributing to the fatigue you have been attributing to “just getting older.”
In my longevity practice, blood work is the foundation of every program. But it is a very different panel than what most physicians order.
The Core Longevity Panel
Metabolic Health
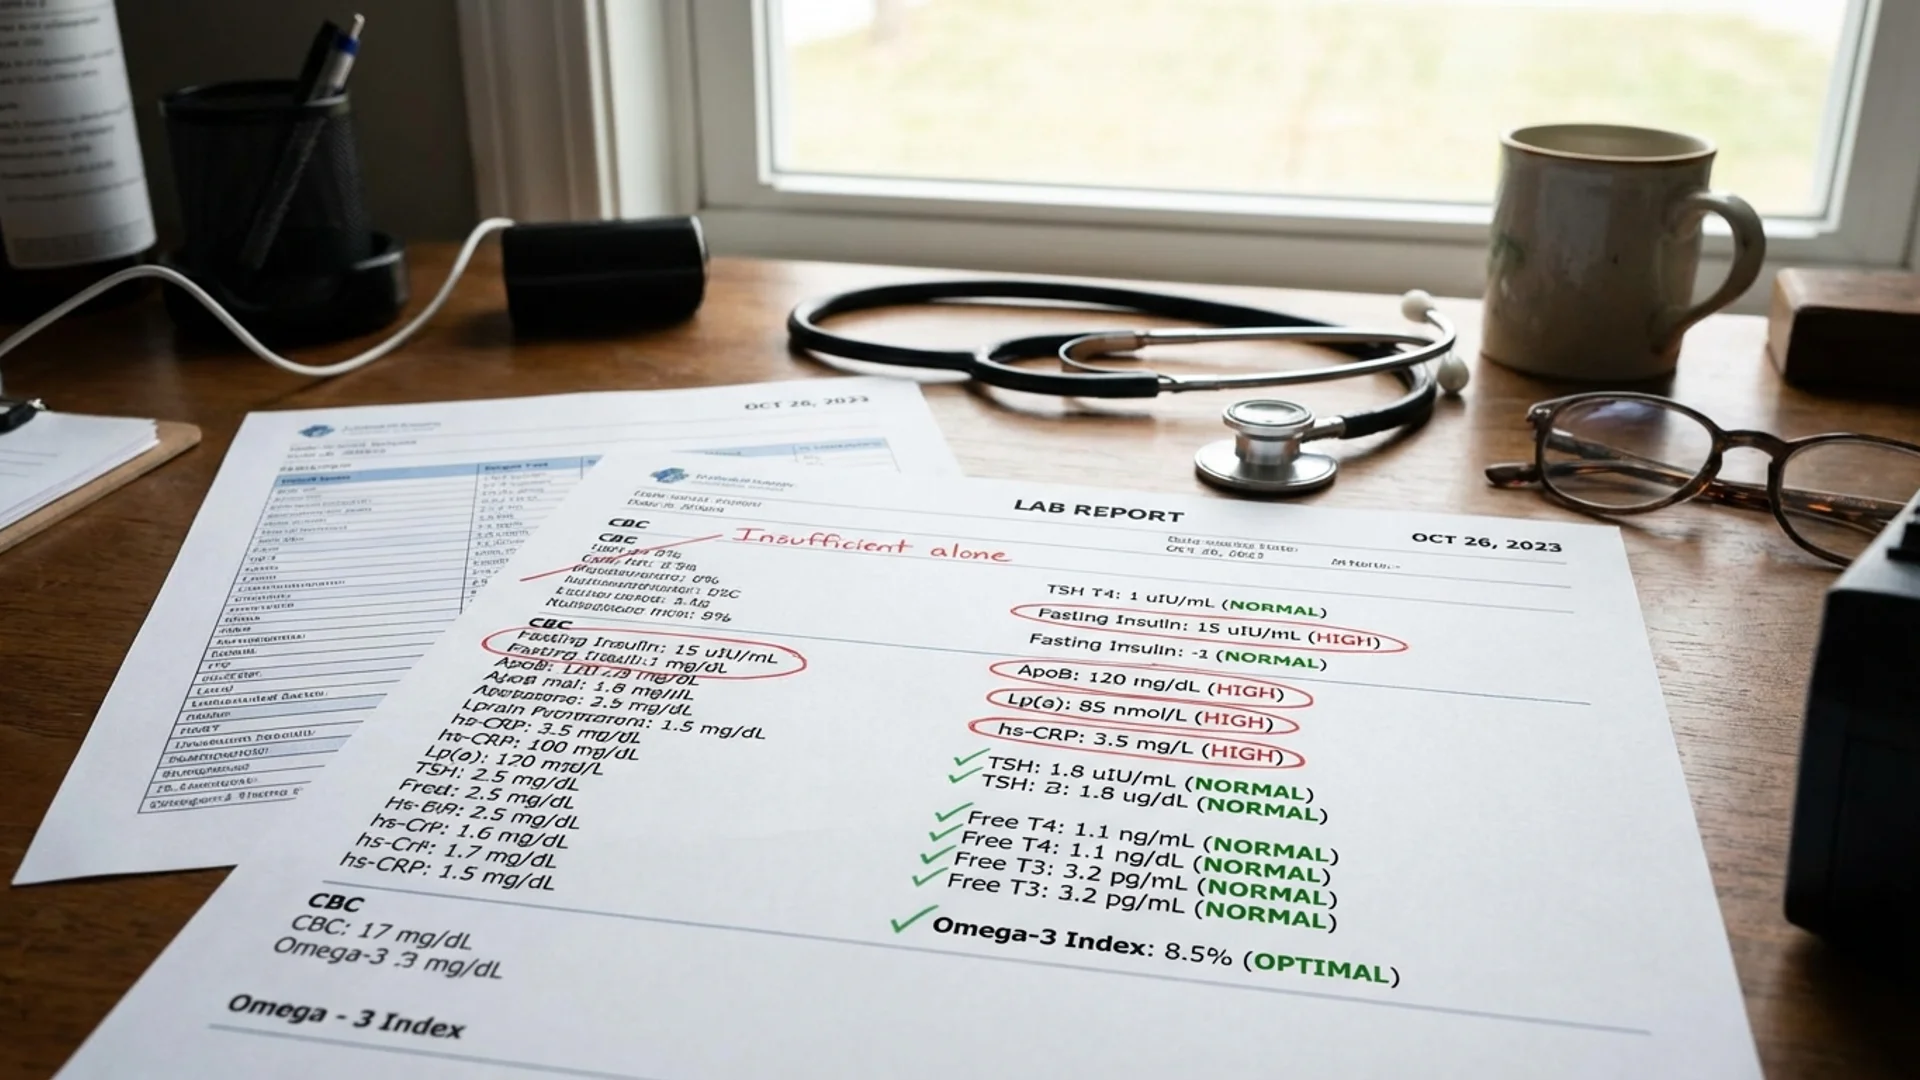
Fasting glucose and fasting insulin: Most physicians test glucose. Far fewer test fasting insulin. This is a significant blind spot. A patient can have normal fasting glucose (below 100 mg/dL) while having elevated fasting insulin — a condition called compensated insulin resistance. The pancreas is working overtime to maintain normal glucose. By the time glucose rises, the metabolic dysfunction has been present for years.
Optimal fasting insulin: below 5-7 mIU/L (not merely “in range”)
HbA1c: Three-month average glucose. Standard test, but I want it below 5.3% for longevity optimization, not merely below the diagnostic threshold of 5.7%.
HOMA-IR: Calculated from fasting glucose and insulin. The most practical clinical estimate of insulin resistance.
Lipid panel (advanced): Standard lipid panels report total cholesterol, LDL, HDL, and triglycerides. These are starting points. For serious cardiovascular risk assessment, I add:
- ApoB: A better predictor of cardiovascular risk than LDL-C. Each atherogenic particle carries one ApoB molecule, making it a direct count of atherogenic particles.
- Lp(a): Genetically determined, not modifiable by lifestyle, and a significant independent cardiovascular risk factor. Every adult should know their Lp(a) level. It only needs to be tested once.
- LDL particle number and size (if available): Small, dense LDL particles are more atherogenic than large, buoyant ones.
Triglyceride-to-HDL ratio: A simple, practical marker of insulin resistance and metabolic health. Optimal ratio: below 1.5 (in mg/dL units).
Inflammation
hsCRP (high-sensitivity C-reactive protein): The most widely validated systemic inflammatory marker. Optimal: below 1.0 mg/L. Above 3.0 mg/L indicates significant systemic inflammation that warrants investigation.
Homocysteine: Elevated homocysteine is an independent cardiovascular risk factor and a marker of B vitamin metabolism (B6, B12, folate). Optimal: below 8 micromol/L.
Ferritin: Often thought of as an iron marker (which it is), ferritin is also an acute phase reactant and inflammatory marker. Elevated ferritin in the context of normal iron studies suggests inflammation. Very low ferritin (below 30 ng/mL) indicates iron depletion, which impairs mitochondrial function and energy.
Uric acid: At mildly elevated levels, uric acid contributes to metabolic syndrome and cardiovascular risk. At very low levels, it may indicate inadequate antioxidant capacity. Optimal range: 4-6 mg/dL.
Hormonal Status
Men: Total testosterone, free testosterone (or calculated bioavailable testosterone), SHBG, estradiol (sensitive assay), LH, FSH, DHEA-S, cortisol (morning). See my men’s hormone article for interpretation.
Women: Estradiol, progesterone (timed to cycle phase if premenopausal), FSH, LH, total and free testosterone, DHEA-S, cortisol (morning). See my women’s hormone article.
Both sexes: Comprehensive thyroid panel (TSH, free T4, free T3, reverse T3, anti-TPO, anti-thyroglobulin). Standard TSH alone is insufficient.
Organ Function
Complete blood count with differential: Baseline immune status, red cell indices, platelet count.
Comprehensive metabolic panel: Kidney function (creatinine, GFR, BUN), liver function (AST, ALT, GGT, alkaline phosphatase, albumin), electrolytes.
GGT deserves specific mention. Gamma-glutamyl transferase is often overlooked but correlates with oxidative stress, liver health, and cardiovascular risk. Optimal: below 20 U/L.
Micronutrient Status
Vitamin D (25-OH): Optimal: 40-60 ng/mL. Deficiency is extremely common and impacts immune function, bone health, mood, and cancer risk.
Magnesium (RBC magnesium, not serum): Serum magnesium is tightly regulated and can be normal even in significant deficiency. RBC magnesium provides a more accurate assessment.
Zinc and copper: Both are important for immune function, enzymatic activity, and hormonal health. The zinc-to-copper ratio matters — excessive copper relative to zinc is associated with oxidative stress.
Vitamin B12 and folate: Essential for methylation, DNA repair, and neurological function. Methylmalonic acid can be added for a more sensitive assessment of B12 status.
Omega-3 index: Measures EPA+DHA as a percentage of total red blood cell fatty acids. Optimal: above 8%. Below 4% is associated with significantly elevated cardiovascular risk.
Advanced Markers (Longevity-Specific)
IGF-1: Growth hormone mediator. Context-dependent — very low levels suggest GH deficiency; very high levels may indicate increased cancer risk. There is no single “optimal” number, and interpretation requires clinical context.
Cystatin C: A more accurate marker of kidney function than creatinine in many populations. Elevated cystatin C is also associated with cardiovascular risk and accelerated biological aging.
NT-proBNP: Cardiac stress marker. Even mildly elevated levels in asymptomatic individuals may indicate subclinical cardiac strain.
Interpreting Results: The “Optimal” vs. “Normal” Distinction
This is where longevity medicine diverges from conventional medicine. Reference ranges on laboratory reports are defined by the central 95% of the population. In a population where metabolic disease is endemic, “normal” may not be optimal.
For example: a fasting glucose of 99 mg/dL is “normal” by laboratory standards but is one point below the prediabetic threshold. A fasting insulin of 15 mIU/L is “within range” at most laboratories but indicates meaningful insulin resistance.
I help patients understand that the goal is not to be within the reference range. The goal is to be in the range associated with the lowest disease risk and the best long-term outcomes.
Frequency
I recommend comprehensive longevity blood work:
- At baseline (the initial assessment)
- At 8-12 weeks after initiating any hormonal or metabolic intervention
- Every 6-12 months for ongoing monitoring
- More frequently if active treatment adjustments are being made
The Bottom Line
Blood work is the most accessible window into your biological state. But the window needs to be wide enough to see what matters. A standard annual physical draws a fraction of the markers needed for meaningful longevity assessment. Investing in comprehensive baseline testing — and understanding what the numbers mean in context — is the foundation of any evidence-based longevity program.
This content is educational and does not constitute medical advice. Blood work should be ordered and interpreted by a qualified physician who can assess results in the context of your individual health history and risk factors.