At a Glance
| Property | Value |
|---|---|
| Evidence Level | Moderate (established biomarkers); Clinical observation (optimal vs. reference thresholds) |
| Primary Use | Early detection of metabolic, thyroid, inflammatory, and nutritional dysfunction |
| Key Concept | Reference ranges represent statistical norms, not physiological optima |
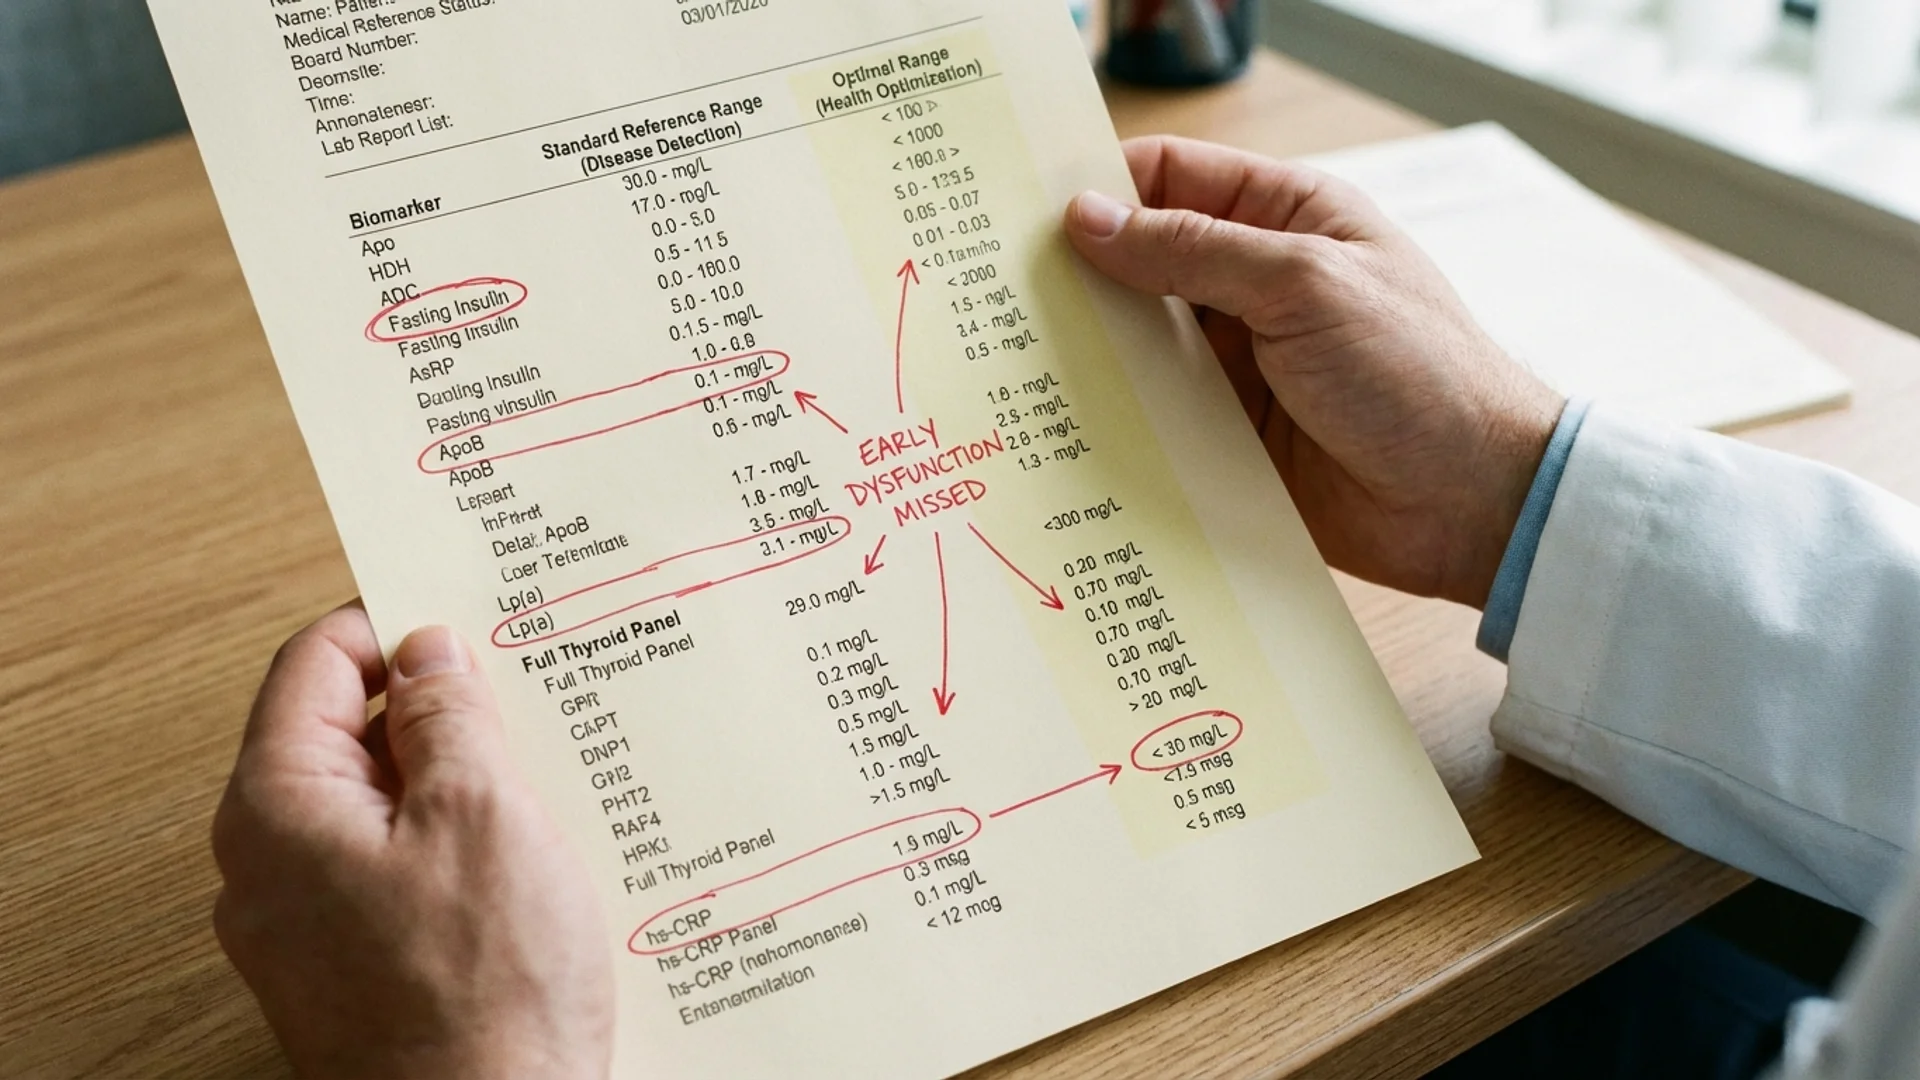
Why “Normal” Does Not Mean Healthy
You go to your doctor. You feel exhausted, your hair is thinning, you have gained weight you cannot explain, and your brain feels like it is running through fog. Blood work comes back. “Everything looks normal,” your doctor says. “Your labs are fine.”
But you are not fine. And the lab results may not be, either — they are just not abnormal enough to trigger a flag in the standard reference range system.
This is one of the most frustrating experiences in modern medicine, and I hear it from patients every week. In my clinical experience, the gap between “reference range normal” and “physiologically optimal” is where a significant amount of preventable disease hides. Understanding this gap is one of the most important things you can do for your own health.
How Reference Ranges Are Created
Let me be direct about what a lab reference range actually represents, because most patients — and many physicians — do not fully understand the methodology.
Standard reference ranges are derived from the central 95% of a reference population. A laboratory collects samples from a group of people, measures the biomarker, plots a bell curve, and defines the “normal” range as the values between the 2.5th and 97.5th percentiles. Anyone falling within this range is classified as normal; anyone outside is flagged as high or low.
The problems with this approach are fundamental:
1. The Reference Population Includes Sick People
The reference population is not a group of optimally healthy individuals. It typically includes everyone who walked into a lab and had blood drawn — many of whom are overweight, insulin resistant, chronically inflamed, sleep-deprived, vitamin-deficient, or in early stages of undiagnosed disease. When you build a “normal” range from a population that includes a substantial percentage of unhealthy individuals, the range itself drifts toward pathology.
This is not theoretical. The average American adult has a BMI of 30 (obese), 38% have prediabetes, and over 50% have at least one chronic condition. When this population defines “normal,” the bar is set remarkably low.
2. Reference Ranges Are Statistical, Not Physiological
A reference range tells you where you sit relative to a population. It does not tell you where your body functions best. The 97.5th percentile for fasting glucose might be 99 mg/dL — technically “normal” — but a fasting glucose of 95 is already associated with increased cardiovascular risk and progressing insulin resistance in longitudinal studies [1].
3. Ranges Vary Between Laboratories
Different labs use different reference populations, different assay methodologies, and different statistical cutoffs. A TSH of 4.2 mIU/L might be flagged as “high” at one lab and “normal” at another, depending on their upper reference limit (which ranges from 4.0 to 5.5 across major labs). This inconsistency creates clinical confusion and delayed diagnosis.
4. Age and Sex Adjustments Are Often Inadequate
Many reference ranges are not stratified by age, sex, or ethnicity — or are stratified too broadly. A ferritin of 30 ng/mL in a premenopausal woman is treated the same as a ferritin of 30 ng/mL in a 60-year-old man, despite representing very different clinical realities.

Optimal Ranges for Key Biomarkers
What follows is not arbitrary. These optimal ranges are based on published research correlating biomarker levels with health outcomes, disease risk, and functional performance — not just population statistics. Where strong evidence defines the optimal range, I cite it. Where the range is informed primarily by clinical experience and functional medicine consensus, I note that.
TSH (Thyroid-Stimulating Hormone)
| Parameter | Standard Range | Optimal Range |
|---|---|---|
| TSH | 0.4 - 4.5 mIU/L (varies by lab) | 0.5 - 2.0 mIU/L |
The standard TSH upper limit of 4.0-4.5 mIU/L has been controversial for over two decades. A landmark NHANES III analysis showed that the 95th percentile TSH in a rigorously screened disease-free, antibody-negative population was approximately 2.5 mIU/L — not 4.5 [2]. This means a TSH of 3.5 or 4.0, while “normal” by most lab standards, may already indicate subclinical thyroid dysfunction.
What I see in practice: patients with TSH levels between 2.5 and 4.5 frequently report fatigue, cold intolerance, weight gain, and cognitive sluggishness that improves when thyroid function is optimized. I am not suggesting everyone with a TSH of 3.0 needs medication — but I am saying that dismissing thyroid involvement based solely on a “normal” TSH is inadequate medicine.
I discuss the full thyroid workup in detail in my complete thyroid panel article.
Ferritin
| Parameter | Standard Range | Optimal Range |
|---|---|---|
| Ferritin (women) | 10-150 ng/mL | 50-100 ng/mL |
| Ferritin (men) | 20-300 ng/mL | 75-150 ng/mL |
Ferritin is the body’s iron storage protein, and its standard lower limit is shockingly low. A ferritin of 12 ng/mL is technically “normal” at most labs, but at this level iron stores are functionally depleted. The patient will have fatigue, hair loss, restless legs, impaired exercise tolerance, and poor cognitive function — all from iron deficiency that does not meet the diagnostic criteria for iron deficiency anemia because hemoglobin has not yet dropped.
Research shows that symptoms of iron deficiency begin at ferritin levels below 30-50 ng/mL in women, well within the “normal” range [3]. Treatment of non-anemic iron deficiency (ferritin < 50 with symptoms) improves fatigue in multiple RCTs, including the landmark PREFER trial.
What I tell my patients: a ferritin below 50 in a symptomatic patient is not “fine.” It is iron deficiency that has not yet caused anemia — and waiting for anemia to develop before treating is waiting too long.
Vitamin D (25-OH-D)
| Parameter | Standard Range | Optimal Range |
|---|---|---|
| 25-OH Vitamin D | 30-100 ng/mL (some labs use 20-100) | 50-80 ng/mL |
The lower limit of 30 ng/mL (or worse, 20 ng/mL) prevents rickets and severe osteomalacia. It does not reflect the level associated with optimal immune function, cancer risk reduction, or cardiovascular protection.
Meta-analyses consistently show that all-cause mortality is lowest at 25-OH-D levels between 40-60 ng/mL [4]. Immune function — particularly NK cell activity and antimicrobial peptide production — peaks at similar levels. The Endocrine Society’s clinical practice guidelines recommend 40-60 ng/mL for optimal health outcomes.
A patient with a vitamin D level of 25 ng/mL is not “normal” — they are deficient by functional standards, even if the lab does not flag it.
Vitamin B12
| Parameter | Standard Range | Optimal Range |
|---|---|---|
| Serum B12 | 200-900 pg/mL | 500-800 pg/mL |
The standard lower limit of 200 pg/mL is the threshold below which frank megaloblastic anemia and neurological damage become likely. But functional B12 deficiency — with symptoms including fatigue, cognitive decline, peripheral neuropathy, and depression — can occur at levels well above 200.
Japanese researchers have long recognized this, which is why Japan’s B12 lower reference limit is 500 pg/mL — more than double the Western standard [5]. When methylmalonic acid (MMA) and homocysteine are measured alongside B12, functional deficiency is frequently documented at B12 levels of 200-400 pg/mL.
What I tell my patients: if your B12 is below 500 and you have neurological symptoms (tingling, numbness, cognitive issues, fatigue), functional deficiency is on the table regardless of what the lab’s reference range says. Measure MMA and homocysteine to confirm.
Fasting Insulin
| Parameter | Standard Range | Optimal Range |
|---|---|---|
| Fasting insulin | 2-25 uIU/mL (varies) | 2-6 uIU/mL |
This is perhaps the single most underused biomarker in conventional medicine. Most doctors do not order fasting insulin at all — they rely on fasting glucose and HbA1c for metabolic assessment. The problem is that insulin rises years to decades before glucose does. By the time fasting glucose is abnormal, insulin resistance has been progressing silently for 10-15 years.
A fasting insulin of 15 uIU/mL is “normal” by most lab standards. It is also a clear sign of significant insulin resistance — the body is producing three to five times the optimal amount of insulin to maintain normal blood glucose. This is the metabolic equivalent of checking the thermostat (glucose) while ignoring the fact that the furnace (insulin) is running at maximum capacity.
Research from the Kraft Insulin Survey (14,000+ patients) demonstrated that insulin patterns predict diabetes, cardiovascular disease, and metabolic syndrome years before standard diagnostic criteria are met [6]. In my clinical experience, fasting insulin is the earliest warning signal for metabolic dysfunction, and I order it on virtually every patient.
hsCRP (High-Sensitivity C-Reactive Protein)
| Parameter | Standard Range | Optimal Range |
|---|---|---|
| hsCRP | < 3.0 mg/L (low risk) | < 0.5 mg/L |
The American Heart Association stratifies cardiovascular risk at hsCRP levels of < 1.0 (low risk), 1.0-3.0 (moderate risk), and > 3.0 (high risk). But these are risk categories, not optimal values. An hsCRP of 2.5 mg/L is “low risk” but reflects substantial systemic inflammation that is driving vascular damage, insulin resistance, and potentially neurodegenerative processes.
In truly healthy, non-inflamed individuals, hsCRP is typically below 0.5 mg/L. Levels above 1.0, even if “normal,” warrant investigation into inflammatory sources: visceral adiposity, gut permeability, chronic infection, periodontal disease, food sensitivities, or environmental exposures.

HOMA-IR (Homeostatic Model Assessment of Insulin Resistance)
| Parameter | Standard Range | Optimal Range |
|---|---|---|
| HOMA-IR | < 2.5 (commonly used cutoff) | < 1.0 |
HOMA-IR is calculated as (fasting glucose x fasting insulin) / 405. It quantifies insulin resistance more precisely than either glucose or insulin alone. A HOMA-IR of 2.0 is below most diagnostic thresholds for insulin resistance, but it is already associated with increased cardiovascular risk and progression toward metabolic syndrome. Truly insulin-sensitive individuals have a HOMA-IR below 1.0.
Homocysteine
| Parameter | Standard Range | Optimal Range |
|---|---|---|
| Homocysteine | 5-15 umol/L | 5-8 umol/L |
Elevated homocysteine (above 10-12 umol/L) is associated with increased cardiovascular risk, cognitive decline, and impaired methylation. It often indicates functional deficiency of B12, folate, or B6 — even when serum levels of those vitamins appear “normal.” Optimal homocysteine is below 8, and levels above 10 warrant investigation and targeted supplementation.
Why This Matters Clinically
The practical consequence of relying on standard reference ranges is delayed diagnosis. Consider this timeline for a patient developing type 2 diabetes:
- Year 0: Fasting insulin begins rising (from 5 to 10 uIU/mL). Labs are “normal.”
- Year 5: Fasting insulin reaches 15 uIU/mL. HOMA-IR is 2.5. Fasting glucose is 92 mg/dL. Labs are still “normal.”
- Year 10: Fasting insulin is 20 uIU/mL. HOMA-IR is 4.0. Fasting glucose is 100 mg/dL (prediabetic by some definitions, “normal” by others). HbA1c is 5.6%. Patient has gained 15 kg and feels exhausted.
- Year 15: Fasting glucose crosses 126 mg/dL. HbA1c reaches 6.5%. Diabetes is officially diagnosed.
For 15 years, this patient was metabolically deteriorating while being told their labs were “fine.” Had fasting insulin been measured and interpreted against optimal (not reference) ranges at Year 0, the trajectory could have been reversed with lifestyle intervention alone.
This is not hypothetical. I see this patient — or a version of this patient — several times per month. In our clinical experience, early identification using optimal ranges and comprehensive panels prevents disease that standard screening misses.
Practical Application: Building a Better Panel
If you want a metabolic and inflammatory assessment that catches dysfunction early, here is what I recommend beyond standard chemistry panels:
| Test | Why It Matters | How Often |
|---|---|---|
| Fasting insulin | Earliest metabolic dysfunction marker | Annually |
| HOMA-IR (calculated) | Quantifies insulin resistance | Annually |
| hsCRP | Systemic inflammation baseline | Annually |
| 25-OH Vitamin D | Immune and bone health | Every 6-12 months |
| Ferritin + iron panel | True iron status | Annually (women: every 6 months if menstruating) |
| B12 + MMA + homocysteine | Functional B12 and methylation status | Annually |
| Complete thyroid panel | TSH alone is insufficient | Annually (see my thyroid panel article) |
| HbA1c | 3-month glucose average | Annually |
| Omega-3 index | Inflammatory balance | Annually |
| ApoB | Superior cardiovascular risk marker vs. standard lipid panel | Annually |
This is not excessive testing. This is competent preventive medicine. The cost of these additional tests is a fraction of the cost of treating the diseases they can prevent.
Safety and Considerations
A few important caveats:
- Optimal ranges are not treatment thresholds. A TSH of 2.5 does not automatically require thyroid medication. It means that if a patient has symptoms consistent with hypothyroidism and a TSH of 2.5, the thyroid should not be dismissed as the cause simply because the number falls within the reference range.
- Context matters. A ferritin of 300 ng/mL is optimal in the reference range sense but may indicate iron overload, inflammation, or liver disease. No biomarker should be interpreted in isolation.
- Do not self-treat based on lab numbers alone. Functional medicine testing is a tool for informed clinical decision-making, not a DIY diagnostic system. Work with a physician who understands optimal ranges and can interpret results in the context of your full clinical picture.
- Insurance coverage varies. Some of these tests (fasting insulin, homocysteine, vitamin D) may not be covered by all insurance plans for screening purposes. Many patients choose to pay out of pocket for comprehensive panels — the cost is typically modest relative to the information gained.
The Bottom Line
The phrase “your labs are normal” should prompt a question, not relief: normal compared to what? A population reference range tells you that you are statistically similar to the general population — a population that is increasingly overweight, metabolically compromised, and chronically inflamed. Optimal ranges, informed by outcome-based research and clinical experience, identify the biomarker levels at which the human body actually functions best. The difference between these two standards is often the difference between catching a problem at year one and diagnosing a disease at year fifteen.
References
- Nichols GA, Hillier TA, Brown JB. Normal fasting plasma glucose and risk of type 2 diabetes diagnosis. Am J Med. 2008;121(6):519-524. PMID: 18501234
- Hollowell JG, Staehling NW, Flanders WD, et al. Serum TSH, T4, and thyroid antibodies in the United States population (1988 to 1994): National Health and Nutrition Examination Survey (NHANES III). J Clin Endocrinol Metab. 2002;87(2):489-499. PMID: 11836274
- Vaucher P, Druais PL, Waldvogel S, Favrat B. Effect of iron supplementation on fatigue in nonanemic menstruating women with low ferritin: a randomized controlled trial. CMAJ. 2012;184(11):1247-1254. PMID: 22777991
- Garland CF, Kim JJ, Mohr SB, et al. Meta-analysis of all-cause mortality according to serum 25-hydroxyvitamin D. Am J Public Health. 2014;104(8):e43-e50. PMID: 24922127
- Mitsuyama Y, Kogoh H. Serum and cerebrospinal fluid vitamin B12 levels in demented patients with CH3-B12 treatment — preliminary study. Jpn J Psychiatry Neurol. 1988;42(1):65-71. PMID: 3398357
- Kraft JR. Diabetes epidemic and you: should everyone be tested? 2nd ed. Trafford Publishing; 2011. ISBN: 978-1426988189